Recently, the inverted yield curve in the U.S. bond market has been a hot topic of discussion, though it’s now easing, leading to mixed opinions among experts about the likelihood of a recession. So, what exactly is an inverted yield curve, and why is it a cause for concern?
To understand this, we first need to break down the basics, starting with the difference between interest rates and yields.
Bonds are debt securities issued by governments and corporations to fund their operations. Investors can purchase bonds from the issuer, who is then required to make interest payments on a regular schedule over a set number of years. The amount of interest paid reflects the prevailing interest rate environment at the time of issuance and is fixed over the life of the bond. This interest rate that the bond issuer will pay to investors, is also known as the coupon. Please note that this Coupon never changes, once bonds are issued. However, the interest rates keep changing, that make the existing bonds less or more attractive, therefore leading to the change in its prices. Here comes the concept of Yields.
- If an existing bond has a higher coupon than a newly issued bond, it generates more interest income. This make investors willing to pay more to own it in the secondary market, pushing its market price up.
- Conversely, if an existing bond has a lower coupon compared to the newly issued bond, the demand for this bond from existing investors will decrease, leading to a fall in its price.
Now, if we compare the current market price of the bonds with its coupon, that gives us the “Yield”. Let’s understand this with an example. A $100 bond is issued at 5% interest rate, which is the coupon. This will give $5 interest income. Now, new bonds are issued in the market at a higher interest rate, thus leading to a decline in the demand of an existing bond. This resulted in the fall of the bond price to $80. Now, the yield of this bond would be 6.25% (5/80). As we see, when interest rates rise, prices of existing bonds tend to fall, even though the coupon rates remain constant, and yields go up.
As we’ve now clarified the distinction between interest rates and yields, we can move on to the yield curve.
What is Yield Curve?
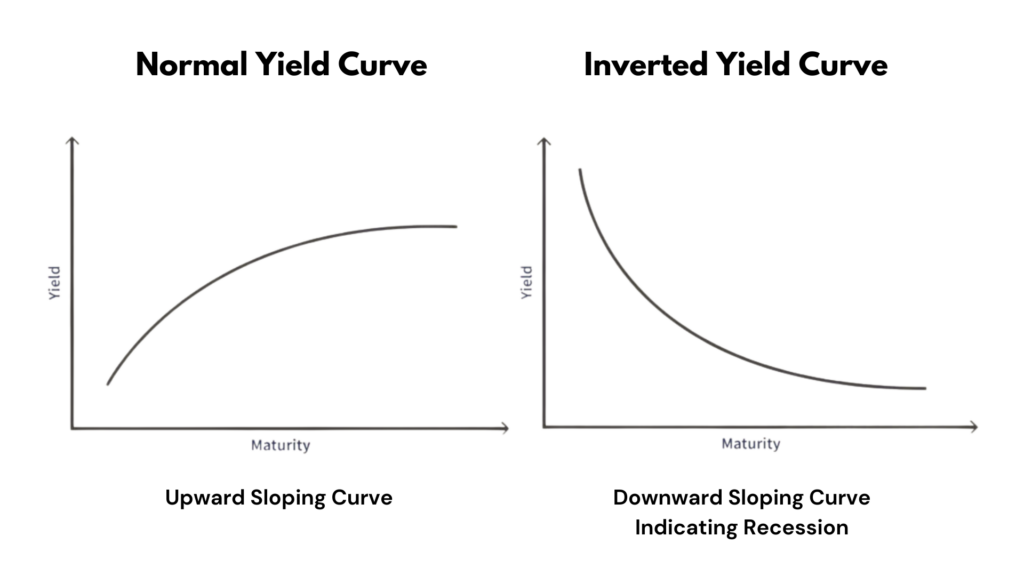
The Yield Curve represents the interest rates on debt across various maturities in graphical form. It shows the yield an investor is expecting to earn when lending his money for specific periods like three months, two years, five years, 10 years and 30 years. The graph depicts a bond’s yield on the vertical axis and the time to maturity on the horizontal axis. While the curve can take different shapes during different economic phases, it typically slopes upwards.
Normal Yield Curve
This is the most prevalent shape for the curve and, therefore, is known as the normal curve. The normal yield curve reflects higher interest rates for 10-year bonds as opposed to 2-year bonds. In a thriving economy, investors generally demand higher yields at the long end of the curve. In short, they would want more compensation for greater risk and therefore the yield on such long term securities will be greater than that offered for lower-risk short-term securities.
Inverted Yield Curve
An inverted curve appears when long-term yields fall below short-term yields. An inverted yield curve occurs due to the perception of investors that in the short term, interest rates will go up but then they expect that higher borrowing rates will hurt the economy so therefore rates will have to come down later. In essence, short-term debt instruments offer higher yields than longer-term ones, signaling that the near future might be riskier than the long term.
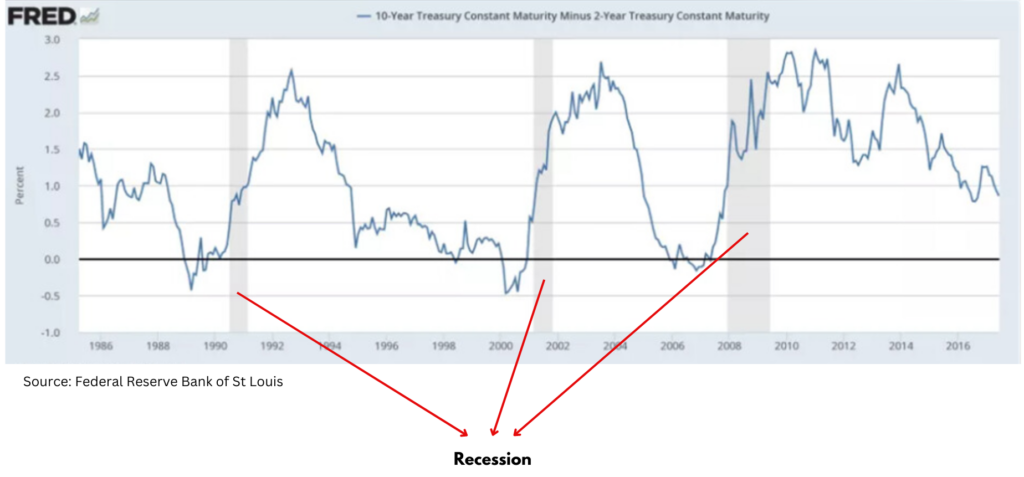
An inverted yield curve is often seen as a warning sign of an impending recession. This inversion between the two-year and 10-year Treasury during 2022-2024, was the longest period of an inverted curve seen in history. While no recession has occurred till now, the historical trends suggest that when the yield curve reverts to normal, a recession begins.
When the yield curve, which is the difference between the 10-year and the 2-year, turns positive, or uninverts, right before the Fed starts cutting interest rates, a recession tends to follow shortly afterwards.
During the timeframe covered by the graph, spanning from 1986 to 2016, the curve inverted three times, each followed by a recession three times: in the late 1980s, the late 1990s and 2007.
Two years of Yield Curve Inversion in the U.S.
In 2022, the yield on two-year US Treasury bonds exceeded the yield on 10-year bonds. Over the span from early 2022 to mid-2023, the Federal Reserve escalated the federal funds rate (the overnight rate banks charge each other for short-term loans) from nearly 0% to a peak of 5.5%, leading to a general increase in yields. The short-term rates (i.e., 3-month Treasury bills) are closely tied to the fed funds rate, hence, the rapid rate hikes by the Fed caused short-term Treasury yields, , to rise faster than long-term yields, resulting in the inversion of the yield curve by July 2022.
In the recent job report issued in September 2024, the unemployment rate marginally decreased in August, and hiring by employers remained subdued compared to previous years. Notably, the unemployment rate dropped sparingly to 4.2% from 4.3%. Post this data, the 2-year yield fell below the 10-year, resulting in an “uninverted” yield curve. The jobs report, along with the release of positive August inflation data, increased the likelihood that the Federal Reserve will start cutting interest rates at its meeting on Sep 17-18, 2024, and potentially further cuts later in the year.
However, this inflection point didn’t happen suddenly. Investors have been anticipating lower rates for some time, prompting yields on shorter-duration securities like the 2-year to decline. However, with not so bad job report and unemployment rate slightly falling, the investors are predicting a 0.25 percentage point cut versus a 0.5 percentage point reduction.
Does a yield curve turning positive poses a risk of recession in the U.S.?
Historically, there have been instances of recessions following the “uninversion” of the yield curve, but there have also been times when the yield curve reverted without an immediate recession. The most recent pre-pandemic example was in September 2019 when the yield curve uninverted, followed by a rate cut by the Fed, yet a recession did not occur until February 2020.
Various experts hold differing views on the significance of the yield curve in predicting recessions. Kristina Hooper, chief global market strategist at Invesco said, “I certainly would not dismiss the ‘disinversion’ of the yield curve, however I am not concerned about an imminent recession as a result.”
On the other hand, Kevin Flanagan from WisdomTree emphasizes that while the yield curve is a vital indicator, other markers, such as the unemployment rate suggest a looming recession based on Sahm rule. The “Sahm rule” implies that when the three-month average unemployment rate rises 0.5 percentage points from its lowest point in the previous 12 months, a recession is imminent. Notably, the last three month average unemployment rate, as of August 2024, stands at 4.2%, which is 0.5% above the lowest point in the last 12 months of 3.7%.
The Sahm Rule, introduced by economist Claudia Sahm, comes with her own acknowledgment that it was “meant to be broken.”
Given these diverse signals and market indicators, the current economic landscape presents an intriguing scenario, questioning whether the US will face another recession or if this recent development is merely a false alarm.
Authored by Ekta Bhatia for Fujn

